AI Automation ROI for UK SMEs: How to Build a Credible Business Case
By NexaCore House
Research checked: 17 October 2026
A credible automation business case starts with the work you can measure: how many enquiries arrive, how much staff time they require, what goes wrong and what it costs to put things right. Compare that baseline with the full cost of the proposed workflow, including integration, human review and maintenance. Then separate the hours released from expenditure you can actually avoid and additional contribution profit you can reasonably attribute to the change.
That distinction can change the investment decision. An automation may create useful capacity while producing little immediate cash return. A simpler rules-based workflow may also offer a stronger financial case than an AI-assisted alternative.
The accompanying Excel workbook makes these assumptions visible. It includes a synthetic enquiry-handling example, a comparison of both approaches and a separate sheet for actual pilot observations. None of the example figures represents a benchmark, forecast or NexaCore client result.
What the UK evidence can tell you
The UK Business Data Survey 2026, published on 18 June 2026, found that 21% of businesses using AI reported integrating their AI tools with existing business systems. Figure 16 uses a base of 1,870 AI-using UK businesses. It is not a rate for all SMEs, and integration includes features embedded in existing software. Fieldwork ran from October 2025 to January 2026.
This finding helps explain why buying access to AI and changing an operational workflow are different implementation questions. It does not demonstrate that integration causes higher ROI.
| Evidence | What it contributes to this decision | What it cannot establish |
| DSIT survey and technical report | Context on integration; definitions, sampling and weighting | Financial returns for your workflow |
| OECD SME technology adoption report | Cost, perceived relevance and vendor trust as implementation barriers | A representative percentage of SMEs achieving positive ROI |
| HM Treasury Green Book | A discipline for comparing options and planning evaluation | A private-sector automation payback benchmark |
The OECD report, published on 22 April 2026, draws on desk research and two fact-finding missions across Greater London, the West Midlands and the North-East. Its observations about barriers should be read in that context, rather than treated as nationally representative survey rates.
No representative UK SME automation ROI benchmark has been established by the sources reviewed here. Your own baseline and pilot therefore carry more weight in this investment decision than adoption headlines. Our guide to UK business AI adoption statistics explains the survey-definition problem in more detail.
Measure the whole enquiry workflow
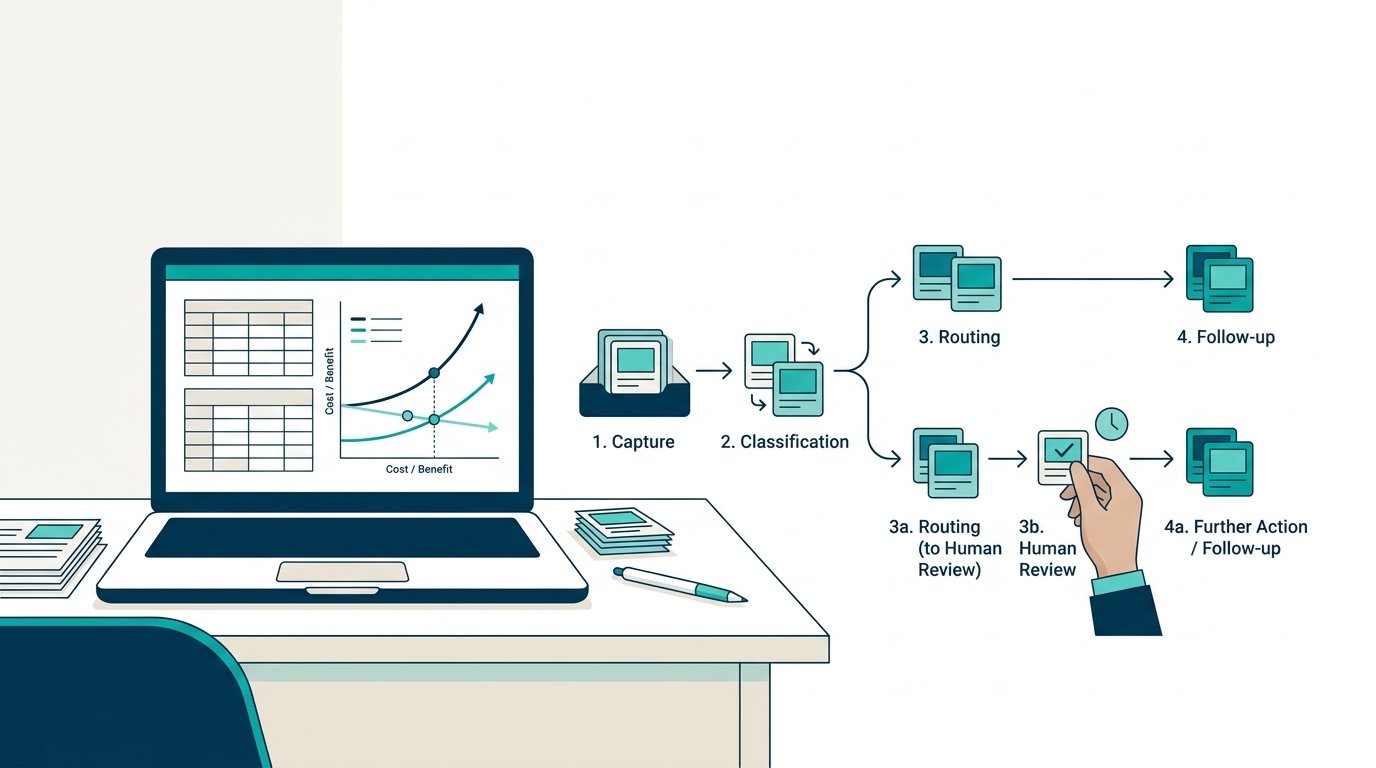
Choose a process with a clear start and finish. For this example, an enquiry arrives, its details are captured, it is classified and routed, a person reviews it where needed, and a follow-up is recorded. Use that same scope for the manual, rules-based and AI-assisted options.
Measure active handling time separately from elapsed response time. A message waiting overnight might take only five minutes of staff effort, while a quick acknowledgement may still leave substantial work for the next morning. Both measures matter, but they answer different questions.
Record routine work, exceptions and rework across a representative mix of enquiries. Include missing details, duplicate messages and incorrect routing. If difficult cases are excluded from the baseline but included in the pilot, the comparison will be misleading. If the pilot runs during an unusually quiet period, explain that too.
In the synthetic baseline, 600 eligible enquiries a month take eight minutes each. That is 80 staff hours. The model values internal time at an illustrative loaded cost of £30 an hour. Neither figure is a recommended planning assumption for another business.
Keep three kinds of benefit separate
Released hours and estimated capacity value
Calculate net hours released after routine handling, human review, extra exception work, rework and internal maintenance. Allow a negative result when the new workflow takes longer overall.
Released time can reduce a backlog or improve service without reducing payroll. To estimate capacity value, identify work that staff can realistically undertake with that time and apply an explicit utilisation assumption. Five minutes scattered across many people may be harder to redeploy than a scheduled block of work.
Actual avoidable expenditure
A cash saving requires a change in spending against a credible alternative: less paid overtime, fewer agency hours or a supplier charge that genuinely disappears. A salary that continues unchanged is not an avoided cash expense.
Before a pilot, these are assumptions. Afterwards, reconcile them to payroll, invoices or a documented staffing decision. The workbook uses £30 for each illustrative avoided hour, but your marginal avoidable rate may differ from your loaded internal cost.
Additional contribution profit
Value extra sales using additional revenue less the variable costs of fulfilling and selling them. Include delivery effort, materials, transaction charges and relevant commissions. Revenue alone overstates the benefit.
Also explain why the additional business is attributable to the workflow. Faster responses may coincide with a new campaign or a seasonal increase in demand. Without a credible comparison, retain the benefit as an assumption or set it to zero.
The workbook allocates positive released hours first to avoided expenditure, then to growth activity. Only the remaining hours receive a capacity valuation. This prevents the same hour appearing in all three benefit categories. Any additional sales delivery effort must already be included in the contribution calculation.
Include implementation and ongoing costs
Build the cost estimate around the work required to make the workflow usable. Include process design, data preparation, integration, testing, staff training and external implementation. Record internal setup time separately from cash payments.
Recurring costs can include licences, usage, hosting, support and monitoring. Someone must also investigate failures, maintain routing rules, check model outputs and update the workflow when systems change. Count that internal maintenance time even if nobody sends an invoice for it.
Avoid charging a cost twice. In this model, internal maintenance reduces released hours, so it is not also added as an economic cost. Internal setup hours enter economic costs once. Cash costs include externally paid maintenance. Apply VAT consistently according to whether it is recoverable.
Compare an AI-assisted option with a simpler alternative. Structured forms and routing rules may be sufficient when the required information and categories are predictable. AI may warrant testing where varied free-text enquiries create a classification problem. Both options must meet the same requirements for capture, routing, review and follow-up.
A worked automation business case
Everything in this section is illustrative. The assumptions demonstrate the calculation method and deliberately allow disappointing results.
The rules-based option retains three routine minutes per enquiry, plus an expected two minutes for exceptions and 0.3 minutes for rework. It therefore releases 27 handling hours, reduced to 25 after two maintenance hours. The AI-assisted option retains 1.5 routine minutes, 1.5 expected exception minutes and 0.3 rework minutes, releasing 47 handling hours or 43 after maintenance.
At full operation, the central rules case allocates five hours to avoided expenditure and five to growth. The AI case allocates five and ten respectively. Growth is valued at an assumed £40 contribution per allocated hour. Remaining capacity is valued at £30 an hour with 50% utilisation.
| Central illustrative assumption or result | Rules-based | AI-assisted |
| Net hours released per full operating month | 25 | 43 |
| Setup cash cost | £1,500 | £3,000 |
| Monthly recurring cash cost | £100 | £200 |
| Full-month avoided expenditure | £150 | £150 |
| Full-month additional contribution | £200 | £400 |
| Full-month residual capacity value | £225 | £420 |
| Total cash costs over the model period | £2,700 | £5,400 |
| Total cash benefits over the model period | £3,675 | £5,775 |
| Cash-based ROI | 36.1% | 6.9% |
| First cumulative cash payback | Month 9 | Month 11 |
| Broader economic ROI | 83.0% | 54.3% |
The model includes setup at month zero and 12 operating months. Net time, internal maintenance and benefits ramp at 25%, 50% and 75% in months one to three, then 100% from month four. Recurring cash costs start in full in month one. This gives 10.5 equivalent months of full benefits.
For the AI case, cash benefits are therefore £550 × 10.5 = £5,775. Cash costs are £3,000 + (£200 × 12) = £5,400. Cash ROI is (£5,775 − £5,400) ÷ £5,400 = 6.9%.
Broader economic ROI adds £4,410 of residual capacity value to benefits and £1,200 of internal setup time to costs. The calculation becomes (£10,185 − £6,600) ÷ £6,600 = 54.3%. That larger number depends on usable residual capacity. It does not represent an equivalent cash return.
The rules-based option has the stronger central cash return under these assumptions. Before paying more for AI, investigate whether its extra capacity or service improvements justify the additional commitment.
Use cumulative payback to expose timing risk
A simple setup-cost-divided-by-monthly-savings calculation misses ramp-up and recurring expenditure. Compare cumulative costs and benefits month by month instead.
The chart shows three synthetic AI-assisted scenarios. The conservative case assumes lower enquiry volume, slower handling and higher costs, with no verified route to cash savings or additional contribution. It never reaches cash payback during the 12 months. The optimistic case reaches it in month six. These are alternative assumptions, not probabilities or a forecast range.
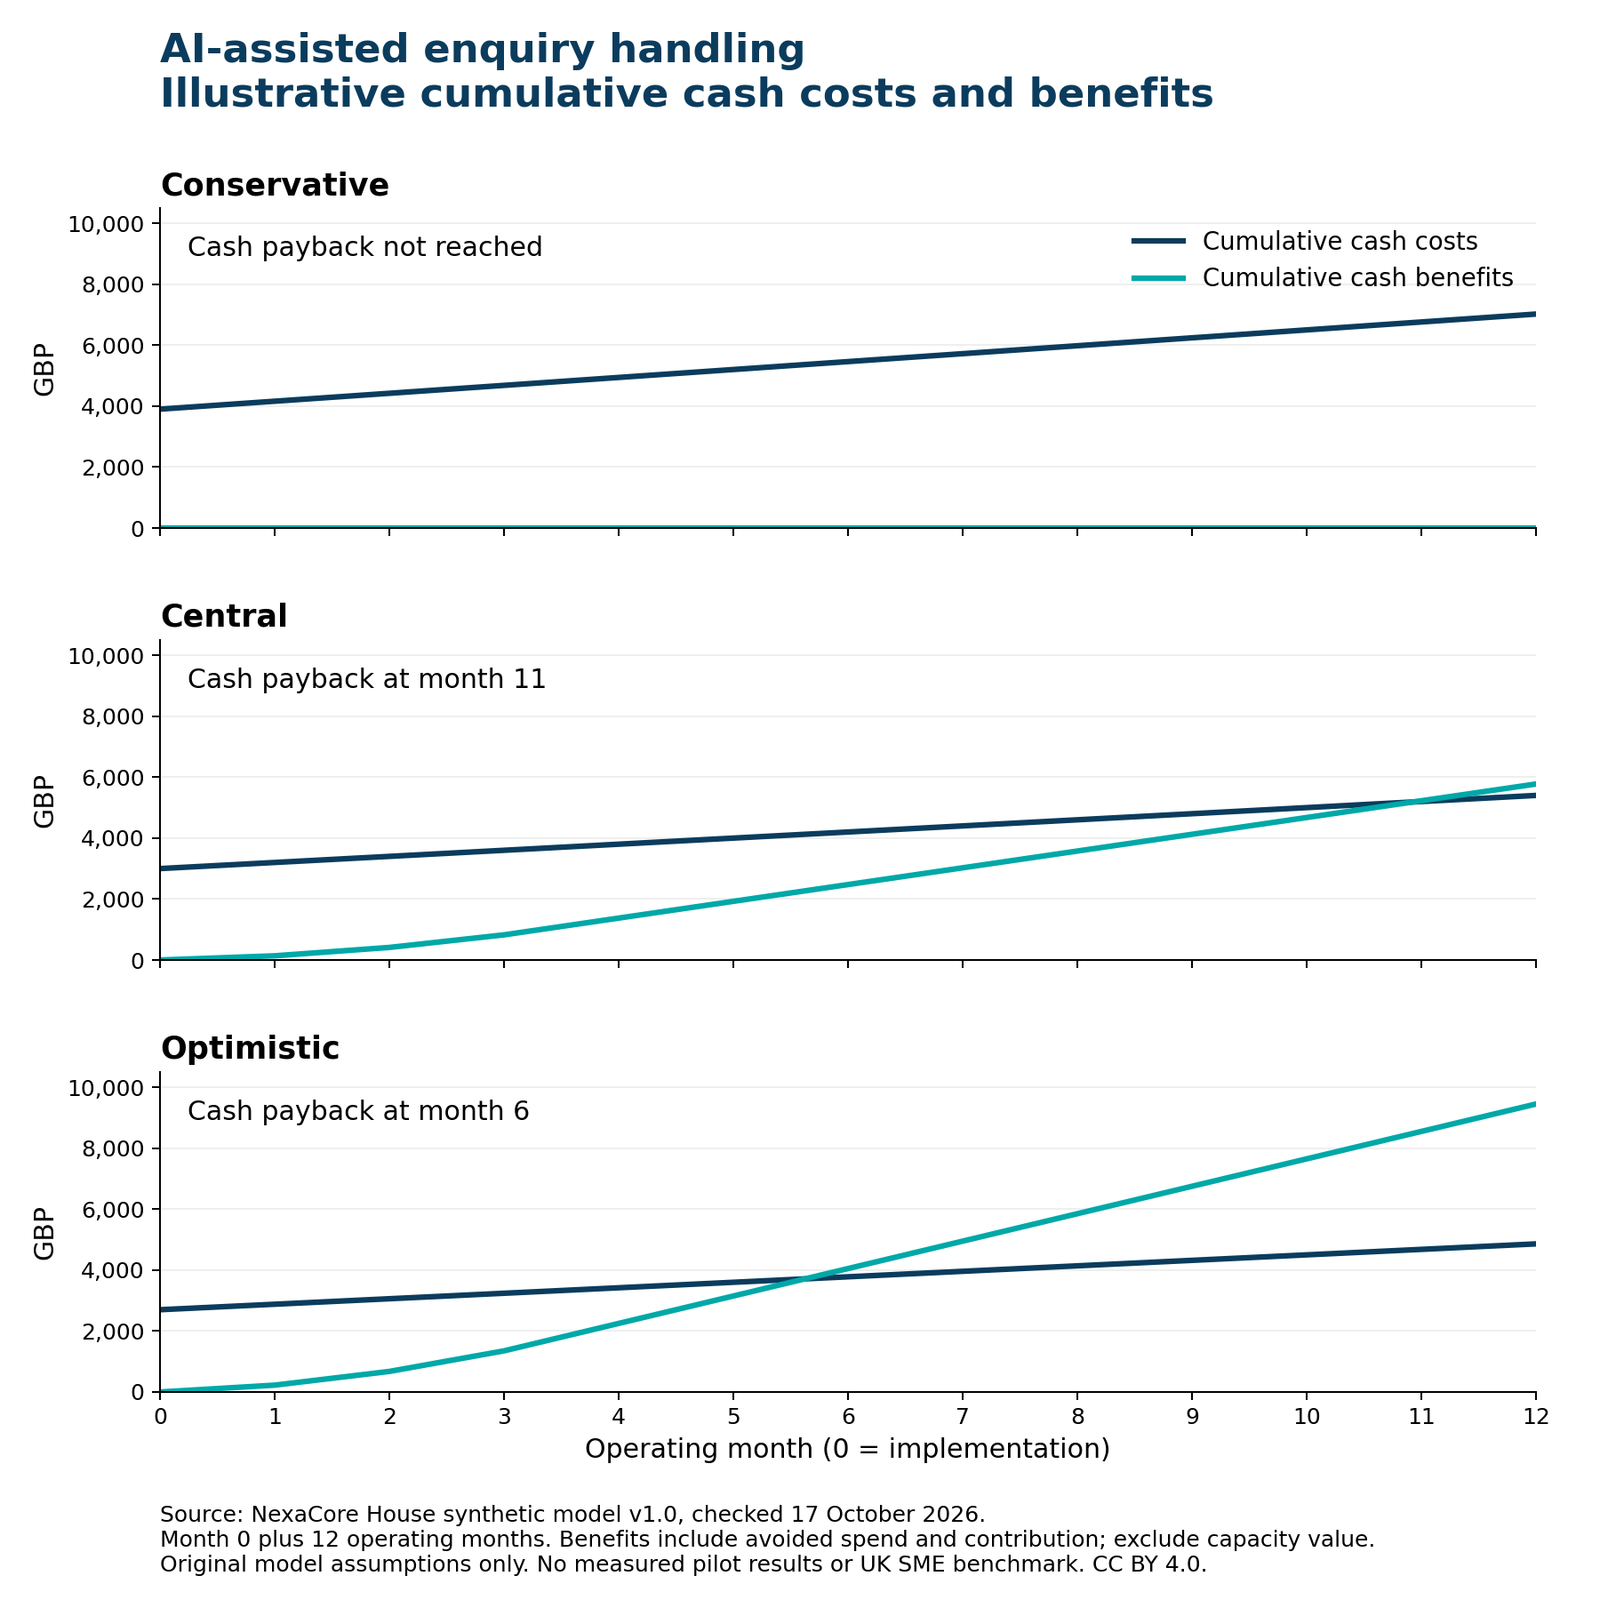
Figure: NexaCore House synthetic model v1.0, checked 17 October 2026. Cash benefits include avoided expenditure and additional contribution; capacity value is excluded. Conservative payback is not reached; central and optimistic payback first occur at months 11 and 6. Original calculations, CC BY 4.0.
Payback means the first month-end when cumulative benefits cover cumulative costs. Later shocks could reverse that position. A business with limited cash should also check payment timing and its ability to fund the initial shortfall.
Turn the pilot into a decision
Before starting, agree a spending limit, a representative enquiry sample and acceptable service quality. Record misrouting, missed follow-ups, review effort and serious errors alongside time and costs. Faster handling alone is insufficient if customers receive incorrect information.
Use comparable manual cases or a staggered rollout where practical. Keep enquiry mix, staffing and marketing changes visible. Small samples and short observation periods limit the confidence you can place in the result.
Enter actual observations in Pilot Results, leaving scenario assumptions separate. Replace estimated avoidable spend with evidenced amounts. Keep unproven contribution at zero. The sheet calculates results for the observed period and does not automatically annualise them.
| Decision | Evidence that would support it |
| Run a bounded pilot | Uncertainty is material, measurable and worth resolving within an agreed budget |
| Expand | Measured benefits justify remaining costs, quality is acceptable and higher volumes are supportable |
| Revise | Exceptions, review effort or integration problems have a specific, testable remedy |
| Stop | Further spending has a weak case, quality is unacceptable or the simpler alternative performs better |
For expansion, judge remaining expenditure and benefits from today. Keep the original full-project return visible, but do not continue merely to recover money already spent.
HM Treasury’s Green Book provides a useful discipline for comparing alternatives and planning evaluation early. It is public spending guidance; this workbook does not claim to implement its social appraisal framework.
Download the workbook and understand its limits
The ungated Excel automation ROI workbook contains Baseline, Costs, Benefits, Scenarios, Pilot Results and Methodology. Formulas are visible and editable. Pilot observations start blank. A scenario CSV (View scenario data) and data dictionary (Read the scenario data dictionary) support reproduction of the chart.
The model uses incremental costs against continuing the manual workflow. Each ROI divides matching net benefits by total costs for the same period. Zero-cost ROI is labelled undefined, negative returns remain visible and unrecovered payback is labelled “Not reached”.
This is an original decision model, not an experiment demonstrating productivity gains. It excludes discounting, tax, financing, inflation, collection delays and value beyond month 12. Extend the analysis for longer commitments. The assumptions and static chart should be revised when your inputs change.
If you need help defining a baseline or evaluating a workflow, discuss the process with NexaCore House. Bring enquiry volumes, handling-time evidence, current systems and the decision you need to make. Our article on AI-powered business intelligence also examines the importance of validation and agreed business measures.
Sources
DSIT: UK Business Data Survey 2026, section 3.2 and Figure 16.
DSIT and Ipsos: UK Business Data Survey 2026 technical report.
OECD: SME Technology Adoption in the United Kingdom.
HM Treasury: The Green Book 2026.
NexaCore House: original illustrative workbook and calculations, version 1.0, checked 17 October 2026.
Update log
19 October 2026: First edition published. 17 October 2026: Research and model checked.